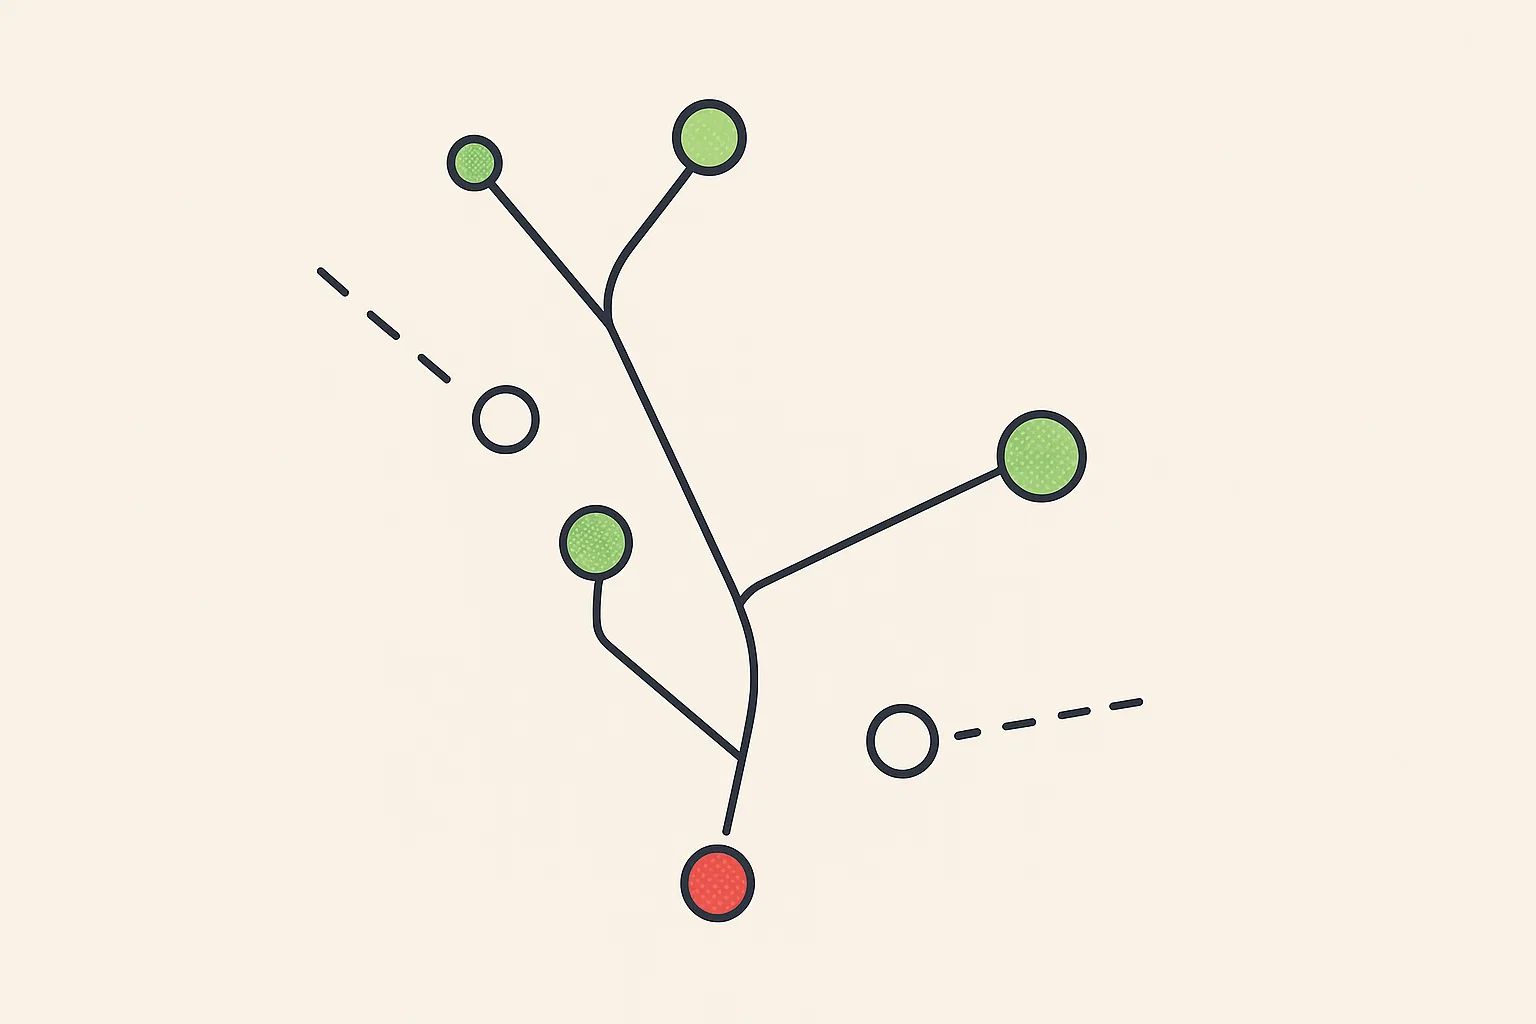
Traceable Flowpaths
Understand how connectivity drives risk, throughput, and intervention decisions
Scroll to Explore
Understand how connectivity drives risk, throughput, and intervention decisions
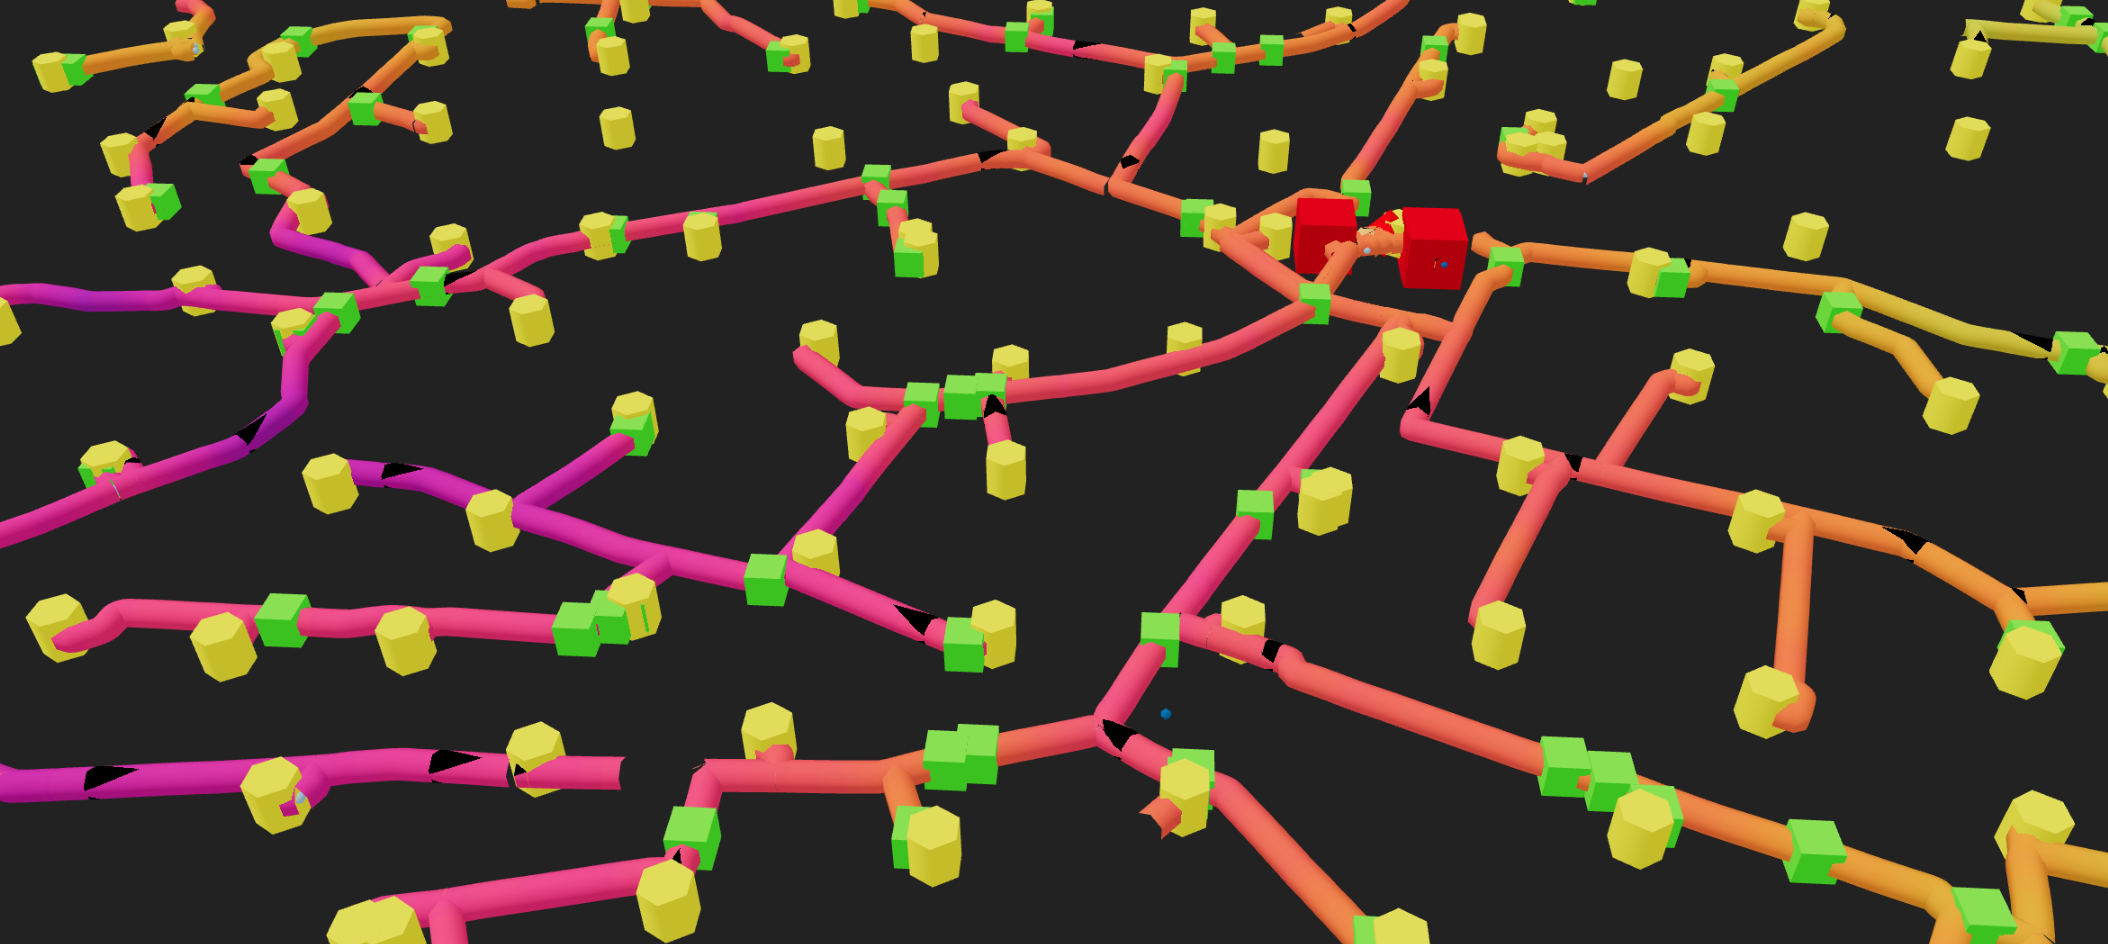
Apply graph analytics to pressure and rate trends to pinpoint shared constraints, identify bottlenecks, and identify the nearest intervention points.
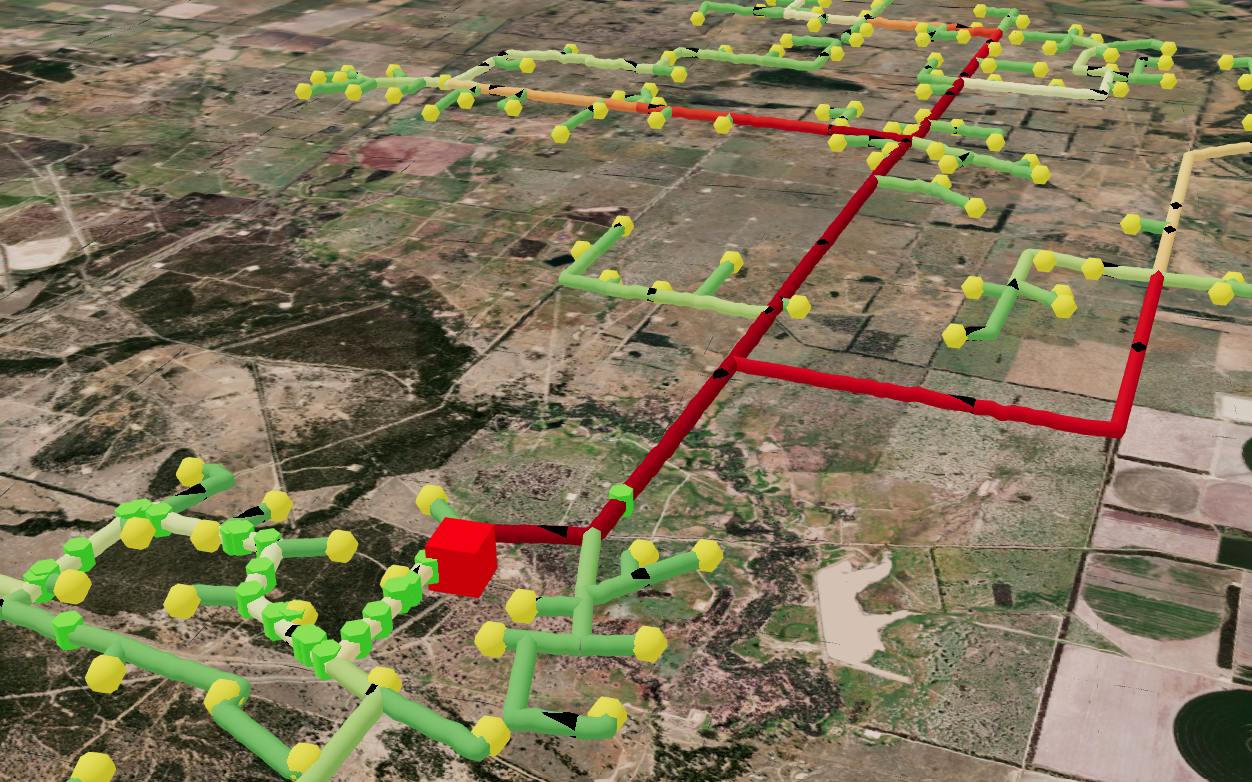
Analyse all your existing asset and operational data ontop of a connected foundation. Know what's connected to what and leverage it in your decision making.
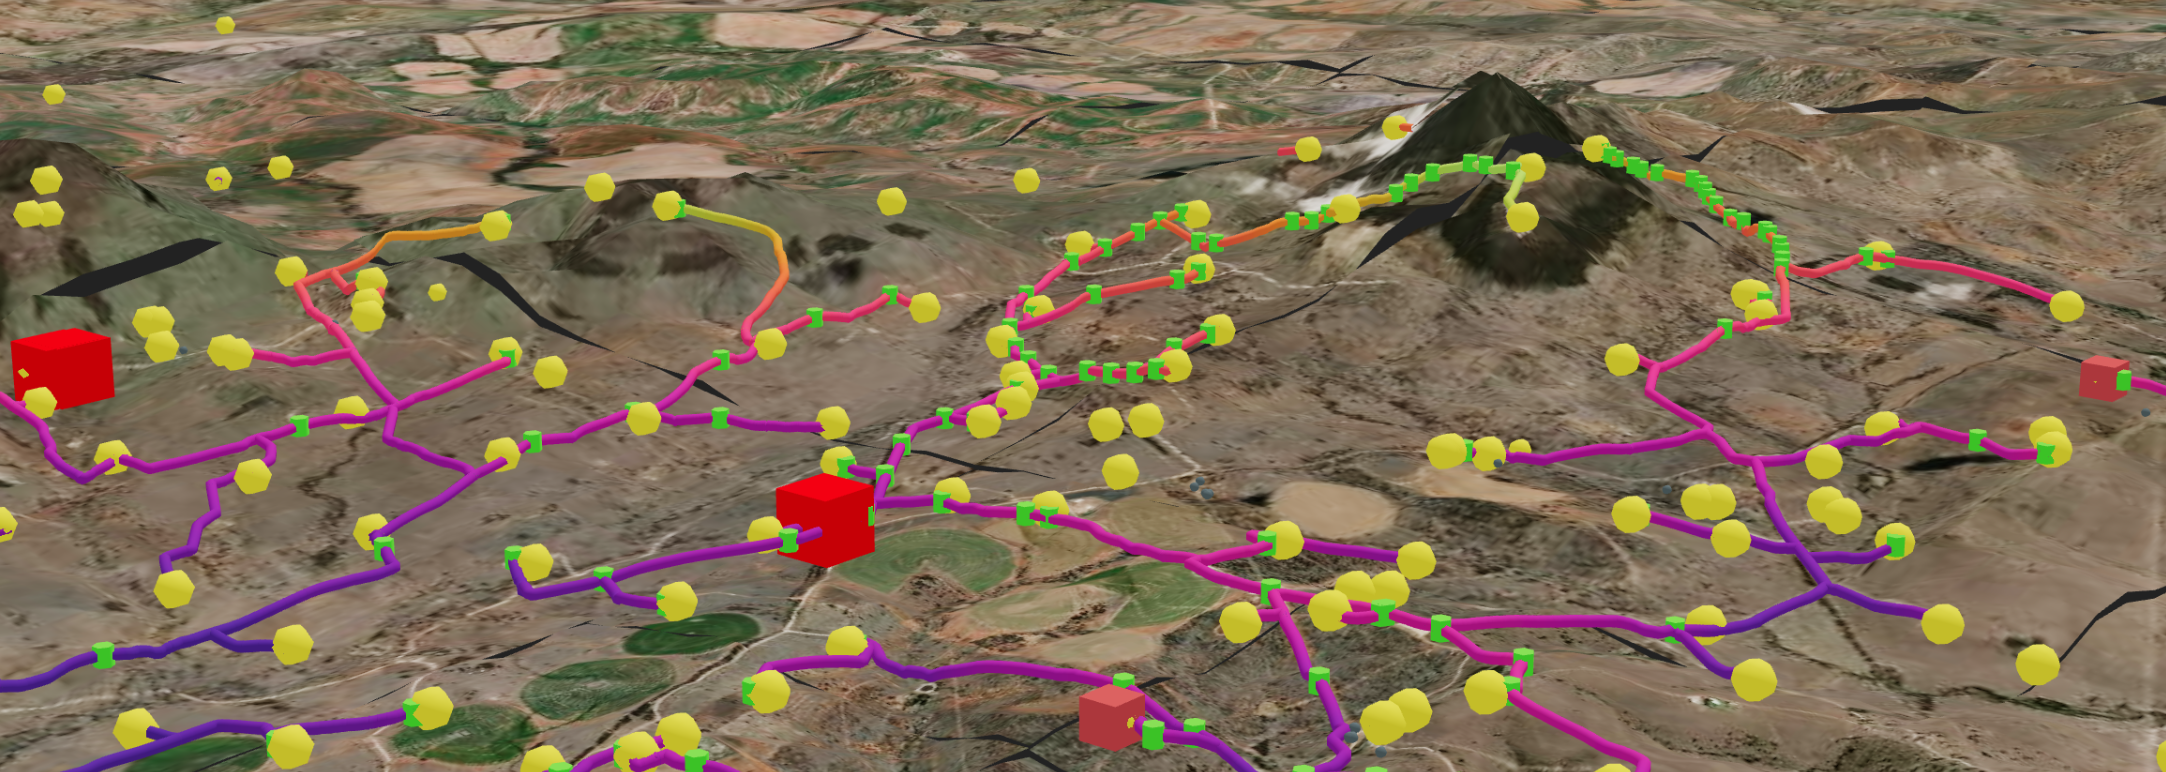
Trace every upstream contributor to a point of interest so teams can prioritise maintenance, respond to leaks, and assess impact instantly.
Schedule a session to explore how Endla maps connectivity, scores criticality, and accelerates response.